Candlesticks
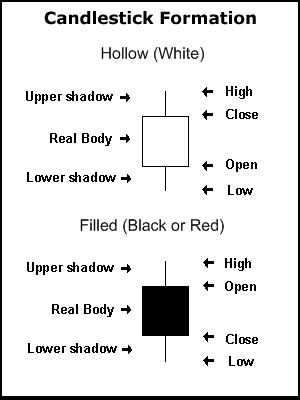
A single candlestick shows how a stock traded within a certain time frame (minutes, days, weeks or even months). The candle stick can tell you where the stock opened and closed as well as its high and low.
The rectangle portion of the candlestick is called “the body” and the thin lines above and below the body represent the high/low range. If the stock closes higher than its opening price, a hollow (or white) body is drawn. If the stock closes lower than its opening price, a filled (or red) candlestick is drawn.
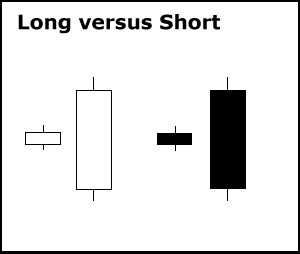
Long Vs. Short Bodies
The size of the body reveals how intense the buying or selling pressure was for the designated time frame. Long hollow (or white) candle sticks show strong buying pressure while long filled (or red) candlesticks show strong selling pressure. After extended declines, long candlesticks can mark a potential turning point or support level.
Long Vs. Short Shadows
The upper and lower shadows on candlesticks can tell a lot about the trading session. Candlesticks with short shadows indicate that most of the trading action was confined near the open and close, while candlesticks with long shadows indicate that the price extended well past the open and close.
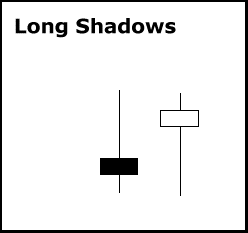
Candlesticks with a long upper shadow and short lower shadow show buyers dominated during the session and pushed prices higher, but sellers later forced prices down from their highs before close. On the other hand, candlesticks with long lower shadows and short upper shadows show that sellers dominated during the session and drove prices lower, but buyers later bid prices higher by the end of the session.
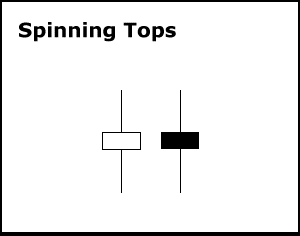
Spinning tops are candlesticks with long upper and lower shadows with small bodies. These candle sticks are known for representing indecision. The small body shows little movement from open to close and the shadows indicate that both bulls and bears were active during the session but neither could gain the upper hand. Spinning tops can signal both the top of a run and the bottom of a decline.
Doji
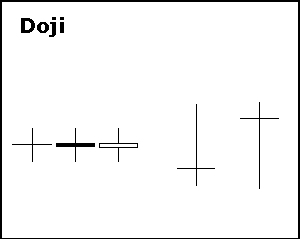
The doji is formed when a stock’s open and close are exactly or almost equal. The length of the upper and lower shadows can be long or short, but the resulting candlestick looks like a cross or plus sign. Although a doji can help signal a reversal much like the spinning top, they should never be used alone. Any bullish or bearish signal using the doji is based on preceding price action and future confirmation.
Dragon Fly Doji
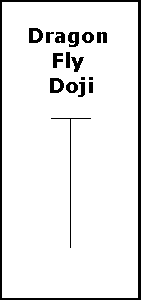
A dragon fly doji is made when the open, high and close are equal, but the stock’s low creates a long lower shadow, creating a candle that looks like a “T”. A dragon fly doji shows that sellers dominated trading and drove prices lower during the session, but that buyers came back and pushed prices back to the opening level and the session high. A dragon fly doji can be used to signal a potential reversal of a downtrend as well as a potential reversal of an uptrend.
Gravestone Doji
The gravestone doji is simply an upside down dragon fly doji. The gravestone doji shows that buyers dominated trading and drove prices higher during the session, but that sellers pushed back and drove prices back to the opening level and the session low. As with the dragon fly doji, the gravestone doji only indicates a reversal based on previous price action and future confirmation. Even though the long upper shadow shows a failed rally, the intraday high shows there is buying pressure, so bearish or bullish confirmation is required.

Additional Chart Topics
TraderPower Featured Companies
Top Small Cap Market News
- $SOBR InvestorNewsBreaks – SOBR Safe Inc. (NASDAQ: SOBR) Closes on $8.2M Private Placement
- $CLNN InvestorNewsBreaks – Clene Inc. (NASDAQ: CLNN) Announces Participation at Two Upcoming Investor Conferences
- $ATBHF Aston Bay Holdings Ltd. (TSX.V: BAY) (OTCQB: ATBHF) Releases Updated Report on Storm Copper Project Drilling Program
- $LGVN InvestorNewsBreaks – Longeveron Inc. (NASDAQ: LGVN) to Present at This Month’s Congenital Heart Surgeons’ Society Annual Meeting
- $LEXX InvestorNewsBreaks – Lexaria Bioscience Corp. (NASDAQ: LEXX) Begins Subject Dosing in Human Pilot Study #3 Evaluating Oral DehydraTECH-Processed Tirzepatide
- $FSTTF InvestorNewsBreaks – First Tellurium Corp. (CSE: FTEL) (OTC: FSTTF) Shares Additional Information on the PyroDelta Thermoelectric Generator, Relationship with Subsidiary
- $TMET.V Gold Stutters as Strong US Jobs Data Dampens Expectations of Large Rate Cuts
- $RFLXF JPMorgan Executive Says US Backlash Against ESG Is Exaggerated
- $SFWJ InvestorNewsBreaks – Software Effective Solutions Corp. (d/b/a MedCana) (SFWJ) Releases Report on Series of Acquisitions, Multiple Cannabis Licenses
- $EAWD IEA Hosts G20 Ministers, Influential Personalities to Discuss Clean and Affordable Energy Transition
Recent Posts
- $EAWD IEA Hosts G20 Ministers, Influential Personalities to Discuss Clean and Affordable Energy Transition
- $SFWJ InvestorNewsBreaks – Software Effective Solutions Corp. (d/b/a MedCana) (SFWJ) Releases Report on Series of Acquisitions, Multiple Cannabis Licenses
- $RFLXF JPMorgan Executive Says US Backlash Against ESG Is Exaggerated
- $TMET.V Gold Stutters as Strong US Jobs Data Dampens Expectations of Large Rate Cuts
- $FSTTF InvestorNewsBreaks – First Tellurium Corp. (CSE: FTEL) (OTC: FSTTF) Shares Additional Information on the PyroDelta Thermoelectric Generator, Relationship with Subsidiary
- $LEXX InvestorNewsBreaks – Lexaria Bioscience Corp. (NASDAQ: LEXX) Begins Subject Dosing in Human Pilot Study #3 Evaluating Oral DehydraTECH-Processed Tirzepatide
- $LGVN InvestorNewsBreaks – Longeveron Inc. (NASDAQ: LGVN) to Present at This Month’s Congenital Heart Surgeons’ Society Annual Meeting
- $ATBHF Aston Bay Holdings Ltd. (TSX.V: BAY) (OTCQB: ATBHF) Releases Updated Report on Storm Copper Project Drilling Program
Recent Comments
Archives
- October 2024
- January 2023
- June 2022
- December 2021
- September 2021
- August 2021
- July 2021
- June 2021
- May 2021
- April 2021
- March 2021
- February 2021
- January 2021
- December 2020
- November 2020
- October 2020
- September 2020
- August 2020
- July 2020
- June 2020
- May 2020
- April 2020
- March 2020
- February 2020
- January 2020
- December 2019
- November 2019
- October 2019
- September 2019
- August 2019
- July 2019
- June 2019
- May 2019
- April 2019
- March 2019
- February 2019
- January 2019
- December 2018
- November 2018
- October 2018
- September 2018
- August 2018
- July 2018
- June 2018
- May 2018
- April 2018
- March 2018
- February 2018
- January 2018
- December 2017
- November 2017
- October 2017
- September 2017
- August 2017
- July 2017
- June 2017
- May 2017
- April 2017
- March 2017
- February 2017
- January 2017
- December 2016
- November 2016
- October 2016
- September 2016
- August 2016
- July 2016
- June 2016
- May 2016
- April 2016
- March 2016
- February 2016
- January 2016
- December 2015
- November 2015
- October 2015
- September 2015
- August 2015
- July 2015
- June 2015
- May 2015
- April 2015
- March 2015
- February 2015
- January 2015
- December 2014
- November 2014
- October 2014
- September 2014
- August 2014
- July 2014
- June 2014
- May 2014
- April 2014
- March 2014
- February 2014
- January 2014
- December 2013
- November 2013
- October 2013
- September 2013
- August 2013
- July 2013
- June 2013
- May 2013
- April 2013
- March 2013
- February 2013
- January 2013
- December 2012
- November 2012
- October 2012
- September 2012
- August 2012
- July 2012
- June 2012
- May 2012
- April 2012
- March 2012
- February 2012
- January 2012
- December 2011
- November 2011
- October 2011
- September 2011
- August 2011
- July 2011
- June 2011
- May 2011
- April 2011
- March 2011
- February 2011
- January 2011
- December 2010
- November 2010
- October 2010
- September 2010
- August 2010
- July 2010
- June 2010
- May 2010
- April 2010
- March 2010
- February 2010
- January 2010
- December 2009
- November 2009
- October 2009
- September 2009
- August 2009
- July 2009
- June 2009


